> For the complete documentation index, see [llms.txt](https://docs.getblock.io/llms.txt). Markdown versions of documentation pages are available by appending `.md` to page URLs; this page is available as [Markdown](https://docs.getblock.io/getting-started/monitoring-and-analytics.md).
# Monitoring and analytics
Track and manage your usage and node service subscriptions with GetBlock.
These tools help ensure optimal use of GetBlock’s services and keep you informed of key metrics and events related to your account.
### Dashboard
The Dashboard provides a quick snapshot of key metrics:
* Your current plan details
* Remaining CU balance
* Rate limit based on your plan
* Total requests made in the last 24 hours
***
### Detailed statistics
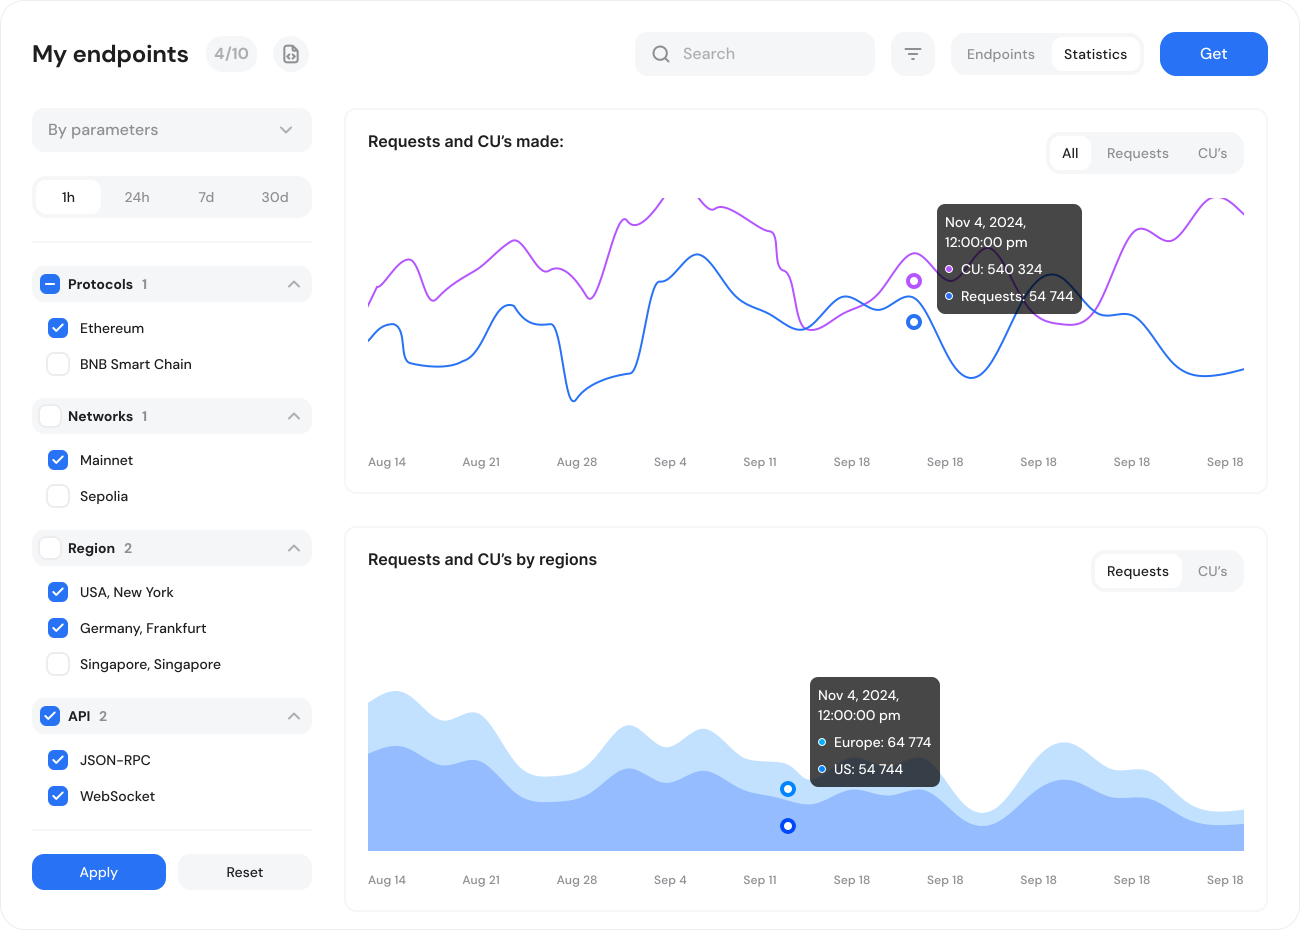
For more detailed analysis, visit the **Statistics** tab in the dashboard.
{% hint style="info" %}
Customize the data view by **parameters** or by **access** **tokens** using the dropdown menu.
{% endhint %}
Select the time period, protocol name, networks (mainnet/testnet), region, and API interfaces to analyze the data by parameters.
The Statistics tab shows more in-depth and customizable data analysis for your endpoints
All data is displayed through infographics, including:
* Number of requests and CUs
* Response statuses
* Method call distribution
* Rate limit rejections